In my post last week, I pointed out that the bell curve works beautifully in many areas of science. It is elegant, simple, and remarkably effective at describing systems driven by many small, independent influences. I also mentioned briefly that many areas of finance have embraced it enthusiastically. It is used in risk management such as Value at Risk ("VaR") models; it underpins the Black-Scholes Model, which is the most commonly used method to price and trade options; it is used in valuation models as well as in portfolio creation and management.
It is ironic that almost to a person the financial practitioners, academics and theorists who use the Gaussian curve recognize that it often fails to predict market behaviors. This insight even made its way into the public consciousness through Nassim Nicholas Taleb's popular book, The Black Swan — The Impact of the Highly Improbable, published in 2007. He points out its many failings and is highly critical of its use.
All of this is well trodden territory, not worth traveling again. However, a couple of questions remain and are worth asking and answering. First, given how well the Gaussian curve seems to describe the physical world, why does it repeatedly fail to accurately describe financial markets and provide a reliable risk management tool? Second, why does the market continue to embrace it notwithstanding obvious and well-documented shortcomings? Let's take these questions in order.
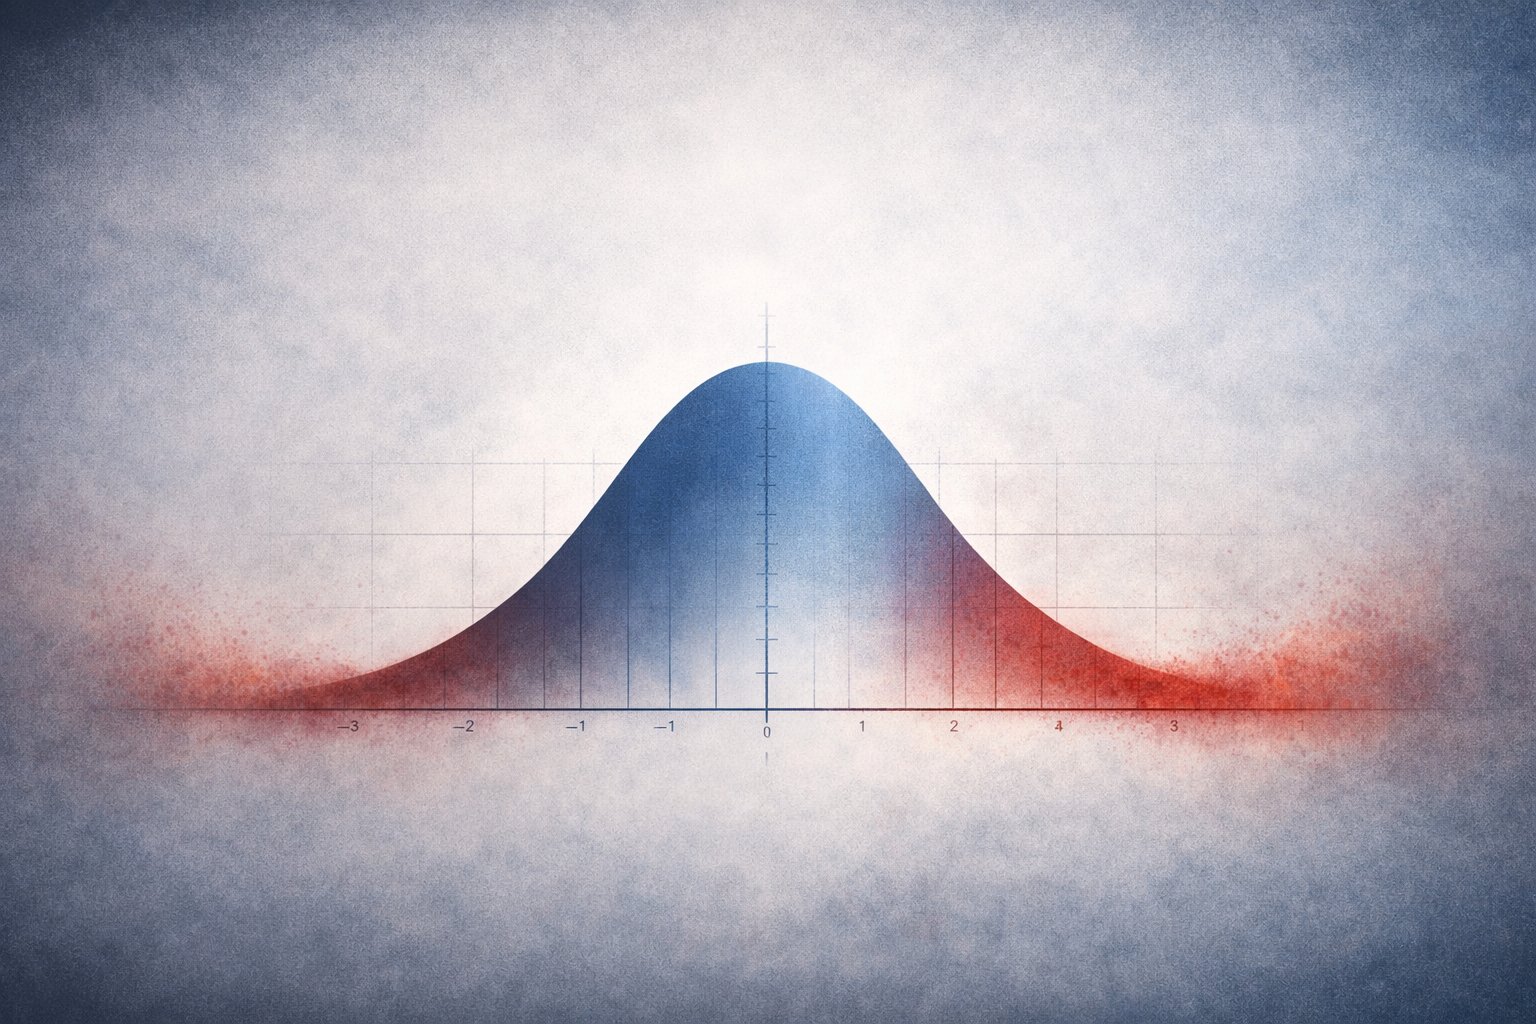
The Gaussian curve — frequently referred to as the bell curve or the normal distribution curve — is a construction of the human mind. Gauss built on the work of many others to develop a formula that would predict the likelihood of outcomes when many small, independent influences combine. In its simplest and most elegant formulation it is a probability density function describing outcomes with two simple concepts — the mean and the standard deviation. It is remarkably accurate in describing many processes in physics, the outcomes of measurement errors as well as physical traits that we observe in the real world including, height, weight, IQ and a host of others.
As noted above, it has been utilized in many areas of finance and works fairly well until it doesn't. We saw it break down at the time of the 1987 stock market crash (I know, I am pretty old), when the hedge fund Long Term Capital Management collapsed (ditto), throughout the great financial crisis that started in 2007, during Covid and many other less traumatic events. Why does this happen?
The Gaussian curve emerges under the conditions described by the Central Limit Theorem which mathematically describes the effect of small, independent and random (a quantum theorist would say "chaotic") factors. But while conceptually elegant, financial markets frequently don't work that way.
First, as has been widely recognized for many years, when financial markets come under stress correlation among various assets tends to increase dramatically. This is often described as "correlation going to one." Second, the behavior of financial markets is often not the result of many small influences. Rather, big macro-economic or political events often dominate as illustrated by the events mentioned above. Third, and quite importantly, markets are not passive systems. They are reflexive and contain numerous feedback loops.
As just one example, price declines create forced selling; forced selling creates further price declines; these declines force more selling through margin calls. What is created is a cascade of impacts all driving the market in the same direction — not smoothed randomness. The net result of all of this are distributions that have fat (heavy) tails, where events that are thought to be 5 standard deviations away from the mean, happen every ten years rather than once every 5,000 years.
If you like, you can look at this through a mathematical lens. The normal distribution assumes finite variance, independent factors and additive processes. Financial markets, however, often involve dependent processes (correlation and contagion), multiplicative dynamics (compounding and leverage), and power-law distributions.
Perhaps an easier way to think about this is to recognize that the normal bell curve breaks down when applied to financial markets not because it is wrong. Rather, the assumptions underlying the curve, which may apply in periods of calm, no longer apply when independence breaks down, extreme events dominate and feedback loops cause effects to compound. Fat tails are not accommodated in the formula for the normal curve; but they are what is actually observed in markets driven by human psychology including greed and fear.
So, if the bell curve is deficient in describing the performance of financial markets, especially in times of stress or turmoil, why does it continue to be used so regularly? As I ask this question I feel like I am living through a déjà vu.
A while ago, I wrote about the cost of equity capital and, not surprisingly, discussed the Capital Asset Pricing Model ("CAPM"). In that context I wrote of our willingness as finance professionals to use models notwithstanding many well understood "theoretical and empirical shortcomings." I managed to give recognition to one of baseball's greats, Yogi Berra, who purportedly said "In theory, theory and practice are the same. In practice they are not." And I noted that Paul Swartz and Philipp Carlsson-Szlezak in their 2024 book Shocks, Crises, and False Alarms, had identified the existence of 'Master Model Envy' as well as 'Physics Envy' among finance professionals (and economists) who desire to explain extraordinarily complex systems with Newtonian-like formulas.
However, this is not a story of would-be physicists pursuing careers in other fields of study. It is about the natural and commendable desire of finance academics and practitioners to develop tools that allow them to make problems quantifiable, actionable and tractable. In finance we consistently use models that we know are not true:
- CAPM — empirically weak, but simple and widely understood
- Gaussian / Normal distribution — underestimates tail risk, but mathematically tractable
- Black-Scholes — relies on unrealistic assumptions, but provides a common pricing framework
- VaR (parametric) — misses extreme events, but is easy to compute and communicate
We do this because they are relatively simple; standardized; computationally convenient; and good enough most of the time. Continuing the déjà vu, when I previously discussed CAPM I pointed out alternatives such as the Fama-French Model and various multi-factor models. Similarly, regarding the normal distribution curve you can move to something probably more accurate — the student's t-distribution; GARCH (which, believe it or not, stands for "Generalized Autoregressive Conditional Heteroskedasticity"); Extreme Value Theory; Pareto power law distributions — but what you gain in accuracy is probably lost in complexity both theoretically and computationally.
The Gaussian curve continues to dominate in finance because in periods of relative calm it often provides a reasonable approximation. It is mathematically tractable, works most of the time (i.e. is accurate in the center and off in the tails), is easily understood and communicated, and is easy to apply through the use of standard deviation and the famous but awkwardly named "z-score." More complex models might appear more accurate, but they are unstable compared to the fixed framework of the Gaussian. Tail parameters shift over time, correlations spike unpredictably and volatility regimes change as a function of time.
And so, the model that underlies the prediction of Ceres's orbit in 1801, and has a history dating back even much earlier, is still used in much of finance over 200 years later. No, it is not close to perfect. But it can be patched with volatility smiles, stress tests, overlays and buffers. It lets us communicate with each other, and work together in a world of uncertainty. Most importantly, there is no replacement for the Gaussian curve in finance because financial markets — involving human beings, human foibles and human strengths and weaknesses — are not governed by a stable, well-behaved probability density function.