In 1801 an astronomer discovered a new object in the sky — what we now know as the asteroid Ceres.
Unfortunately, it disappeared behind the sun after only a few weeks of observations, leaving astronomers unsure where it would reappear.
A 24-year-old mathematician named Carl Friedrich Gauss analyzed the imperfect data and predicted where the asteroid should return.
Months later, astronomers pointed their telescopes at the position Gauss predicted.
Ceres was almost exactly where he said it would be.
The mathematics behind his prediction relied on something we now call the Gaussian distribution — better known as the bell curve.
If you have ever taken a statistics course, studied probability, taken an introductory corporate finance class, or encountered Brownian motion in physics, you have almost certainly seen this curve.
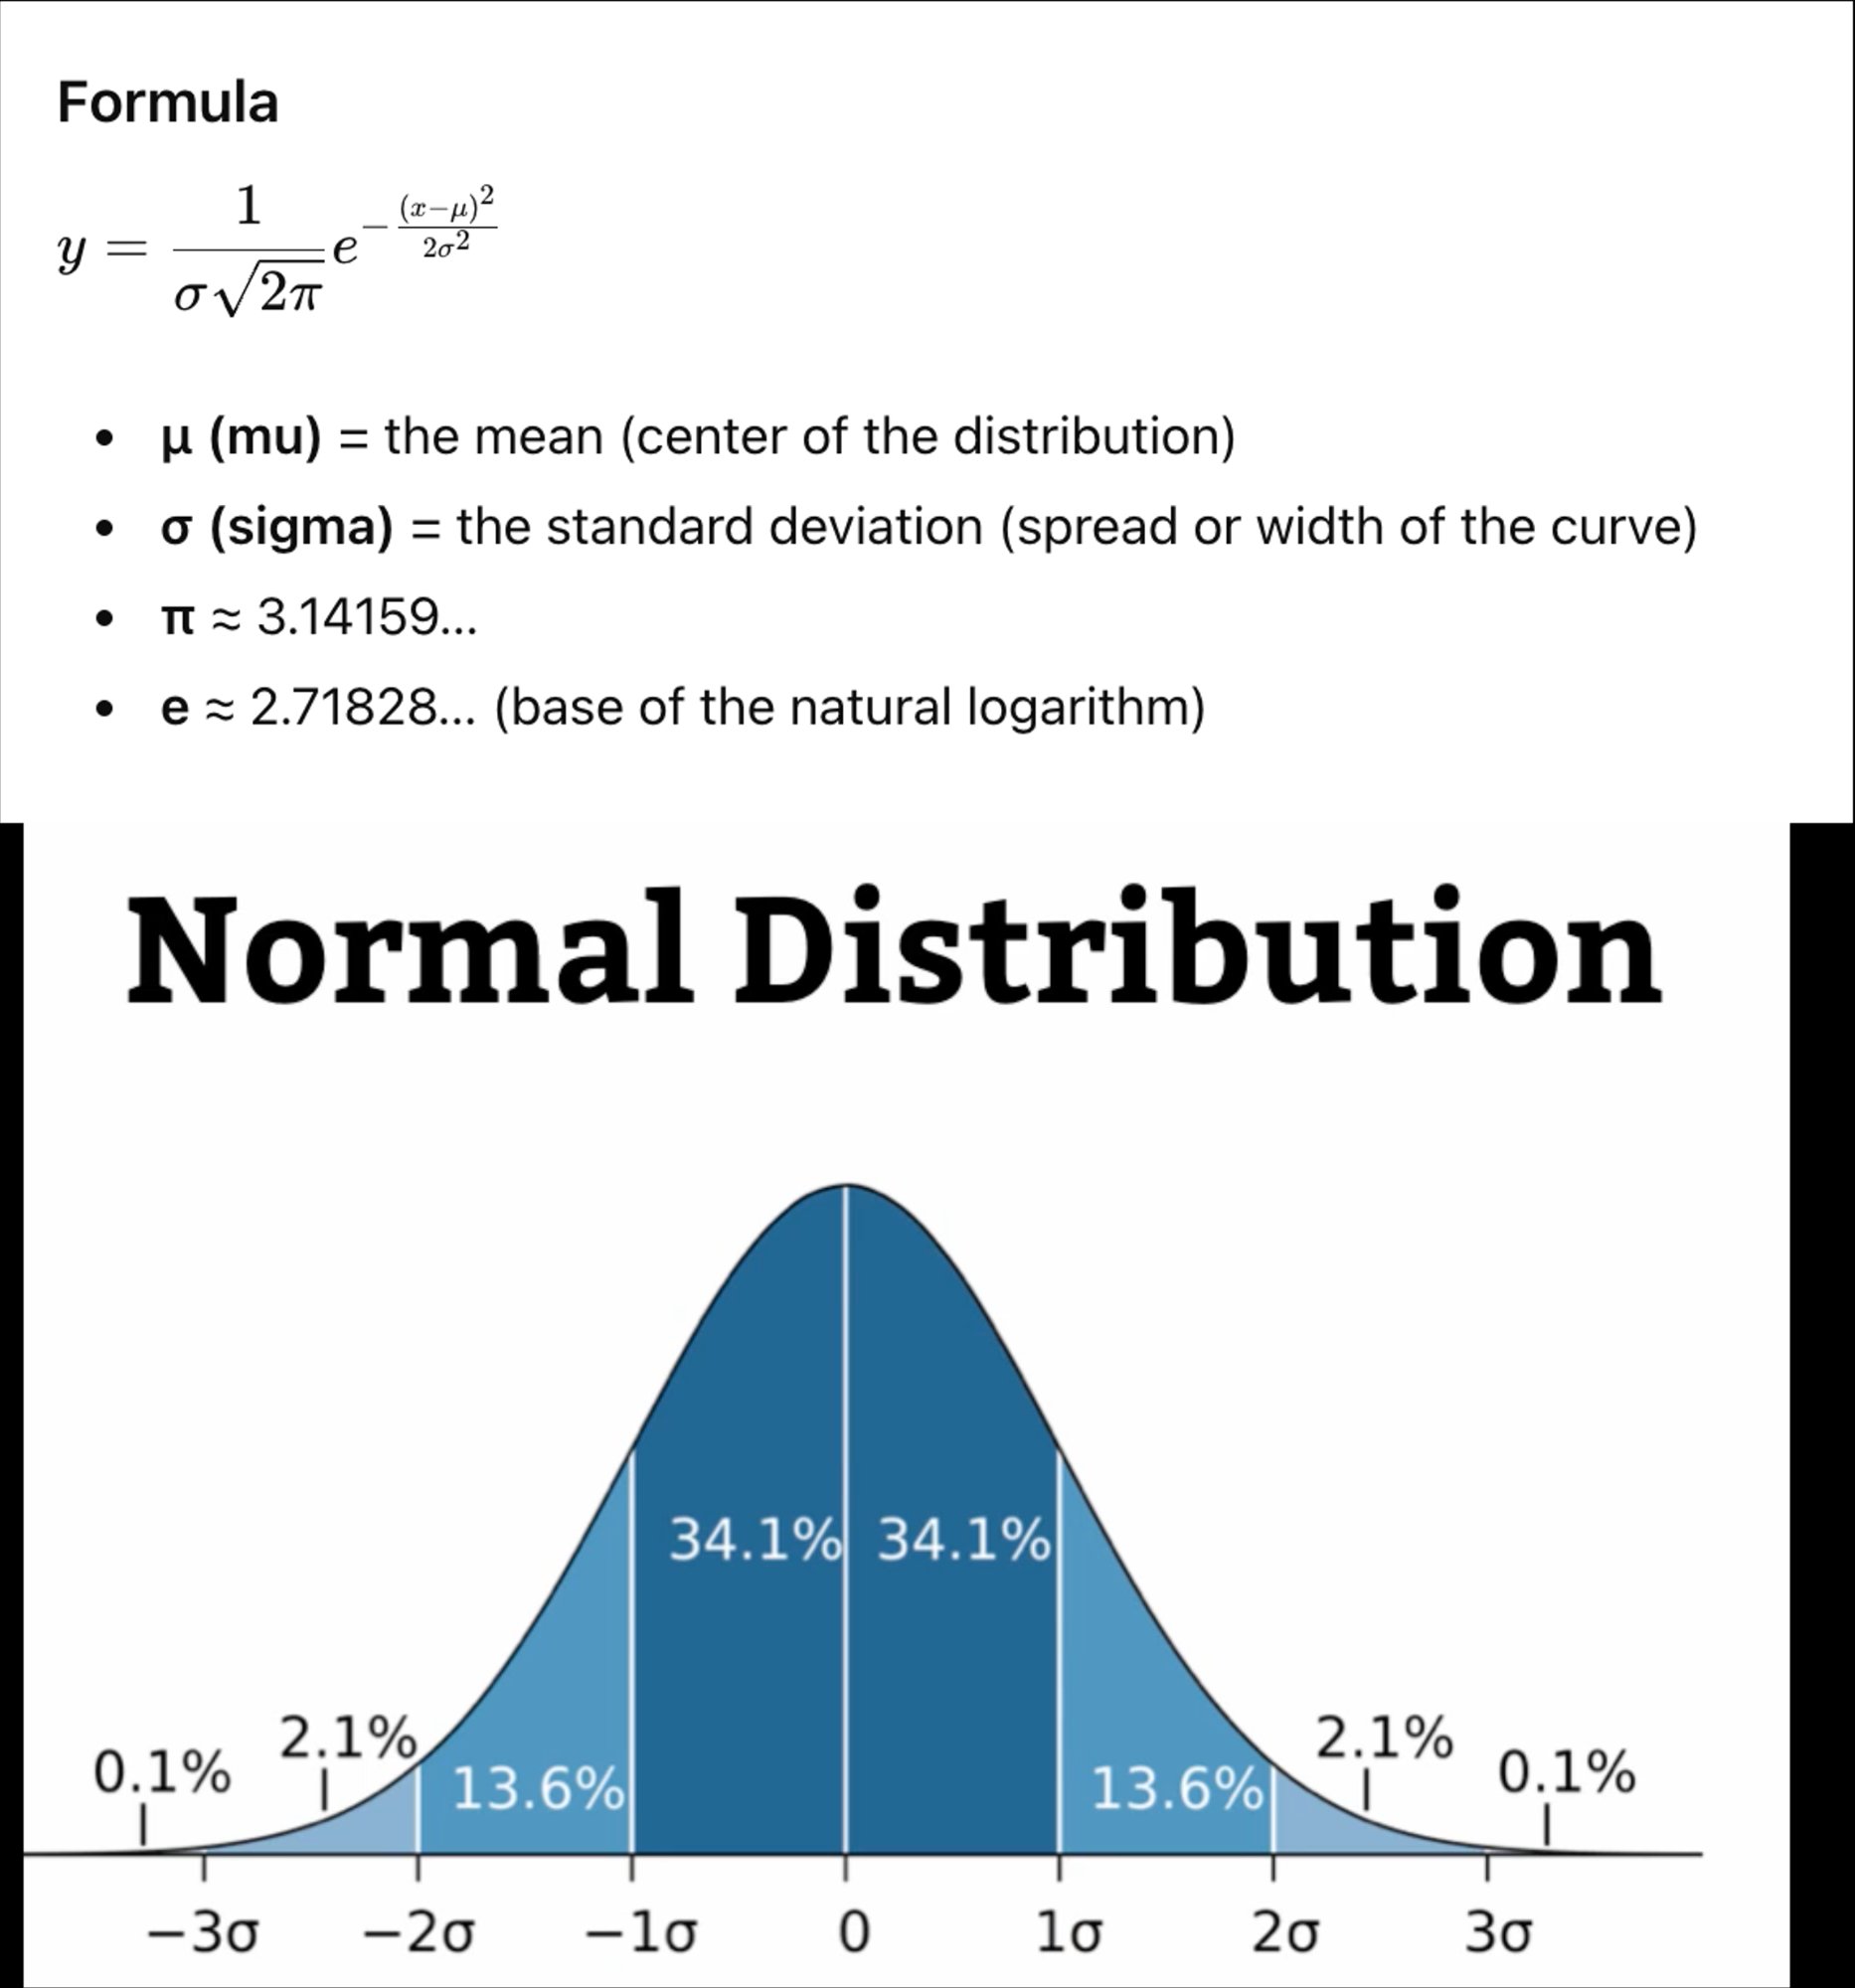
It even has its own famous formula (shown above), which can look intimidating. But you don't need to be a math genius, math geek or even above average in mathematics to make sense of it.
If you are inclined to stare at it and reflect, you will see that the exponential creates an exponential decay of the squared distance from the mean. The first part of the formula is a neat mathematical trick to ensure that the function integrates to 1.
But the truly remarkable thing about the Gaussian distribution is actually its simplicity.
The entire curve is defined by just two numbers:
μ (the mean) — the center of the distribution
σ (the standard deviation) — how spread out the data are
That's it.
From those two numbers comes one of the most recognizable patterns in science: about 68% of observations fall within one standard deviation of the mean, 95% within two, and more than 99% within three.
Those percentages are not arbitrary. They come from calculating the area under the curve between one, two, and three standard deviations from the mean — the integrals of the distribution over those ranges.
I have always found it remarkable that a curve defined by such a simple formula appears so frequently in the real world.
Whenever many small, independent influences combine, the resulting distribution tends to take the shape of this same bell curve. That idea is formalized in what mathematicians call the Central Limit Theorem.
Finance has embraced the bell curve as well — often modeling market returns as normally distributed — although investors occasionally learn the hard way that the real world sometimes produces outcomes further out in the tails than the Gaussian curve would suggest.
In other words, the Gaussian distribution is not just a mathematical curiosity.
It is one of the ways randomness organizes itself in the world — and one of the reasons we are sometimes able to make any sense at all of uncertainty.
I'm genuinely curious: where have you encountered the bell curve in your own work?